AI Data Analysis for Non-Technical People in 2026 | Cliptics

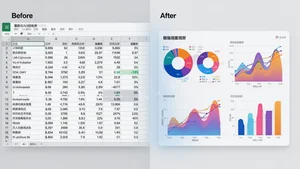
Something shifted this year and I almost missed it. A friend who manages marketing for a mid-sized retail company sent me a screenshot. She had typed "show me which products sold best in Q1 compared to last year" into a tool I had never seen before. Thirty seconds later, she had a color coded bar chart with percentage changes, trend lines, and a written summary explaining the key takeaways. She has never written a line of code in her life.
That moment stuck with me. Because for as long as I can remember, data analysis meant one of two things: either you knew SQL and Python and could wrestle answers out of databases yourself, or you waited three days for someone in the analytics department to get to your request. There was no middle ground.
In 2026, that middle ground finally exists. And it is changing who gets to make decisions based on actual numbers rather than gut feelings.
The Tools That Made This Possible
The shift did not happen overnight. It started with a few companies realizing that the biggest bottleneck in data driven decision making was not the data itself. It was the technical barrier between the people who had questions and the systems that held the answers.
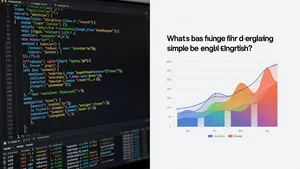
Julius AI was one of the first to crack this open for individuals. You upload a CSV or connect a spreadsheet, type a question in plain English, and get charts and statistical analysis back. No formulas. No pivot tables. No late night YouTube tutorials on VLOOKUP. The tool translates your natural language question into the technical operations needed to answer it, then shows you the result in a format that actually makes sense.
ThoughtSpot took a different approach and aimed at enterprise teams. Instead of traditional dashboards that require training to navigate, they built what is essentially a Google search bar for your company data. Type "revenue by region last quarter" and get an instant visualization. Their Sage AI engine processes natural language queries against live databases, which means you are not working with stale exports. You are querying real data in real time.
Then Microsoft brought Copilot into Power BI, and suddenly the tool that millions of businesses already used got a conversational layer. You can describe what you want to see, and Copilot generates DAX formulas, builds report pages, and writes data summaries. For organizations already in the Microsoft ecosystem, this was the path of least resistance to AI powered analytics.
Google did something similar with Gemini in Sheets. The AI function now handles text generation, categorization, and sentiment analysis across entire columns with a single formula. The Gemini sidebar lets you ask conversational questions about your data and get chart suggestions in seconds. For the billions of people who already live in Google Workspace, analytics suddenly became as accessible as typing a question.
And then there is camelAI, which was purpose built for people who do not write code at all. You connect directly to PostgreSQL, Snowflake, BigQuery, or forty other database sources, type a question like "what were our top 10 products by revenue last quarter," and get an interactive chart instantly. No SQL. No file uploads. No waiting.
Why This Matters More Than You Think
Here is what makes this genuinely significant. The global AI in data analytics market hit roughly $40 billion in 2026 and is projected to reach over $310 billion by 2034, growing at nearly 30% per year. That is not a niche trend. That is a fundamental reshaping of how organizations operate.

And it is not just big companies benefiting. Nearly 80% of businesses are expected to adopt generative AI and natural language processing models by the end of 2026. The reason is straightforward: when everyone on a team can pull their own data insights, decisions happen faster. You do not need to file a ticket with the data team and wait two days for a chart you could generate yourself in thirty seconds.
I talked to a small business owner in Austin who runs a chain of coffee shops. She told me she used to export her sales data to Excel, stare at it for an hour, and then call her accountant. Now she connects her point of sale system to an AI analytics tool and asks things like "which menu items have the highest profit margin on weekdays versus weekends." She gets an answer before her morning coffee gets cold.
That is the democratization people have been talking about for years. It is actually happening now.
What These Tools Get Right (And Where They Still Struggle)
I have spent weeks testing several of these platforms, and the honest truth is that they are remarkable but not magical.
What they get right is the translation layer. The ability to understand "show me customer churn by month" and turn that into the correct query against the right data source. Two years ago, natural language to SQL translation was unreliable. It would misinterpret column names, confuse date formats, or join tables incorrectly. In 2026, the accuracy has improved dramatically. Most tools get simple to moderate queries right on the first try.

Where they still struggle is with ambiguity. If your data has a column called "value" that could mean revenue, quantity, or customer lifetime value, the AI has to guess. Sometimes it guesses wrong. The best tools, like ThoughtSpot and camelAI, handle this by asking clarifying questions. The weaker ones just pick an interpretation and run with it, which can lead to confidently presented but completely wrong charts.
There is also the context problem. A human analyst understands that a sudden spike in returns last March was because of a product recall, not a seasonal trend. AI tools see the numbers but not the story behind them. They can tell you what happened but not always why. This means human judgment still matters. You just do not need human judgment to pull the chart anymore.
The Practical Reality of Getting Started
If you are reading this and thinking "I should try one of these," here is what I would actually recommend based on testing them.
For personal projects and freelancers, Julius AI is the easiest starting point. Upload a spreadsheet. Ask a question. See what happens. The free tier is generous enough to figure out whether this approach works for you.
For teams already using Microsoft tools, Power BI with Copilot is the natural choice. You are not adding a new tool. You are unlocking a feature in something you already pay for.
For small businesses that need live database connections without a data engineer, camelAI offers 10 free queries per week with connections to real databases. That is enough to get started.
For enterprise teams with serious data infrastructure, ThoughtSpot or Tableau with Einstein AI provide the governance and security layers that larger organizations require.
What I Keep Thinking About
The part that fascinates me most is not the technology itself. It is the shift in who gets to ask questions.
For decades, data literacy meant learning tools. Excel. SQL. Python. Tableau. R. Each one was a gate you had to pass through before you could talk to your own data. And each gate filtered out people who had great questions but not the technical patience or training to formulate them in a language computers understood.
Now the computer is learning our language instead. You do not need to think in columns and rows and joins and aggregations. You just need to know what you want to know.
That sounds simple. But it changes everything about who participates in data driven decisions. The store manager who notices a pattern. The teacher analyzing test scores. The nonprofit director tracking donation trends. The small business owner wondering whether Tuesday promotions actually work.
These are people who always had the questions. They just never had the tools to answer them on their own.
I still think you need a healthy skepticism when using these tools. Always sanity check the results. Understand that the AI might misinterpret your question. Know that correlation shown in a pretty chart is not the same as causation.
But the barrier to entry has dropped from years of technical training to minutes of curiosity. And that shift, quiet as it has been, might be one of the most meaningful things happening in technology right now.